1 Introduction
Soil erosion and non-point pollution caused by intensive agricultural activities and poorly managed soil farming caused nutrient load to cause degradation of aquatic habitats and coastal vegetation (fish spawning areas, bottom animals), rapid loss of reservoir capacity and shortened service life, nutrients The transport of particles and toxic substances leads to eutrophication, poisoning and turbidity of the water body.
Watershed management urgently needs the approximate estimation method and model simulation of the watershed scale, and can use real-time investigation of soil erosion and reservoir siltation pollution data to compare with the calculation results of the model, so as to determine that the model can be used for the measurement of non-station watershed non-point source pollution, And dynamic simulation of key pollution sources after the use of regulatory measures, pollution changes.
2 Application of the system
The water and soil non-point source pollution survey and dynamic evaluation system assists in the formulation of watershed management strategies by determining the point source / non-point source ratio in the total load, using model calculations and comparison with actual surface source pollution surveys, and identifying the key points with the largest contribution of non-point source pollution in the watershed.
It can be used in the management of large-scale watersheds with or without stations, assessment of climate change, design of optimal watershed management, non-point source pollution control, pollution discharge control, wetland nutrient monitoring and other fields.
3 System composition
Water and soil non-point source pollution investigation and dynamic evaluation system is composed of PhosFate model and pollution investigation system.
The PhosFate model (Kovacs et al. 2008) is a GIS tool for simulating hydrological, soil erosion, point source and non-point source pollution P emissions and their transport in watersheds and river networks. Through simulation calculations at the watershed scale, nutrient emissions from erosion and non-point source pollution are reduced. The model combines the advantages of a single empirical model and a physical boundary watershed model with clear boundaries. It is built from existing independent methods. These independent methods are finally modified into a common model framework through proper modification and extension. in.
Regarding spatial variability, PhosFate completely ignores river flow and water quality components. All inputs and results of the model are "long-term averages."
The PhosFate model is mainly divided into two parts: erosion / emission and transport submodels.
The input data of the model is as follows (for hydrology and erosion simulation):
n Digital map (elevation, land use type, physical topsoil quality, humus content)
n Meteorological data (average precipitation in time scale, rainfall distribution related to different rainfall intensity, average potential evapotranspiration, temperature and wind speed)
n Point source information (reservoir location and operating volume)
Watershed hydrology is calculated using WetSpass long-term hydrology model (Batelaan and Woldeamlak, 2004).
Surface runoff calculation is based on soil type, land use type, potential runoff coefficient depending on slope, and distribution coefficient related to soil infiltration capacity. The reference evapotranspiration is calculated using the mature Penman-Monteith equation. The actual evapotranspiration is obtained by revising the reference evapotranspiration using a constant water correlation coefficient. Infiltration and groundwater replenishment are the remaining conditions of the water balance equation, describing the soil surface and topsoil layer respectively.
Soil loss is calculated using the general soil loss equation (USLE, Novotny, 2003).
A separate unit is added to the transport submodel to provide interaction between adjacent units and to calculate the local sediment transport flux in the watershed. The model separately calculates water, sediment, ground surface dissolved phosphorus (DP) and particulate phosphorus (PP) emissions, underground emissions and point source emissions. The calculated results are the total discharge, sediment, DP and PP load values ​​at any point in the watershed, the components of these values ​​(surface, underground, point sources) and the retention model of sediment and P in the watershed.
The pollution survey system can measure nutrient parameters such as nitrate, nitrite, ammonia nitrogen, and phosphate at various points in a portable manner. It can also be fixed at the observation point for long-term, dynamic observation of nutrients or physical and chemical parameters of water bodies.
4. System technical indicators
Calculation area: 10,000 square kilometers-50,000 square kilometers
Basic unit area: 100m x 100m
Unit calculation parameters: vegetation interception, surface runoff, surface infiltration, actual evapotranspiration, groundwater recharge
Output: BMPs, retention of river bed and reservoir bottom, nutrient load
Algorithm:
1. Estimate the reachable gain of each unit
2. Interfere with the unit under the guidance of the maximum attainable gain (change the land use method)
3. Implement model calculation in the affected area (upstream / downstream adjacent units of the intervened unit)
4. If the budget is used up, go to step 5, otherwise repeat from step 1.
5. End
Measuring range:
Ammonia nitrogen: 0 ~ 0.4 / 1/2/5 / mg / l, other ranges can be customized
Nitrate + nitrite: 0 ~ 0.5 / 1/5/10 mg / l, other ranges can be customized
Nitrite: 0 ~ 0.1 / 0.2 / 0.5 mg / l, other ranges can be customized
Phosphate: 0 ~ 0.3 / 1/2/5 / mg / l, other ranges can be customized
5. Application Case
5.1 Watershed management assessment
The PhosFate model tool allows the preparation of best management measures (BMPs) for the watershed and can simulate the possible impact on sediment and nutrient loads. A variety of BMP alternatives and combinations between them can effectively reduce soil erosion (Campbell et al., 2004). The model pays particular attention to rural land use management, including changes in land use methods, changes in farming methods, buffer zones and wetland establishment, such as source control interventions that reduce runoff and soil loss as a means to reduce changes in farming methods (such as the direction of farmland , Protected arable land, contour planting, post-cultivation mulch, terraced farming, etc.) also have an effect on soil erosion values.
Based on the planned interventions, after modifying the land use map and running the discharge and transport model, the improved hydrological and load reduction effects can be simulated.
The model can also track point source emissions within the river network. The model can calculate the retention of the river bed and the bottom of the reservoir, so it can simulate the distance from the downstream target (river section or still water).
The effect of long-distance point sources.
5.2 Assessing climate change
Because some input data are climate variables, PhosFate can be used to carry out climate change impact assessments. Because the output is a long-term average value, the model can easily modify the input data according to the expected climate change, and there is no need to make a scaled-down forecast for daily or denser time frequencies. Climate conditions can be correlated with expected land use development, creating an integrated framework for forecasting future changes or challenges for watershed management.
5.3 Design of optimal management technology
In order to achieve optimal management (reducing soil erosion at low cost and high efficiency), not all erosion source areas must be covered by interventions, because not all source areas have effective contribution rates to sediment and nutrient loads. The optimal strategy is governed by two target functions (load reduction power at existing fixed costs and cost-effectiveness at fixed pollution limits).
The objective function of the optimization process is to reduce the total amount of SS transported into the river network with the most effective interference method (covering as few units as possible). Or, conversely, how can interventions be used to achieve the maximum benefit of load reduction within a specified number of units?
Units that successfully feed the largest total amount of erosion into the river network can be used as an ideal source control target (reduction of local erosion). However, other units with only a limited erosion rate can also transport a considerable amount of SS from their immediate vicinity. These are the best locations for transport control, which are used to establish detention areas (mostly along the direction of water flow). Arrange the units according to these two characteristics to build the foundation for optimal intervention calculation.
These two types of intervention (source control and transfer control) must be coordinated with each other in the calculation process. If a highly eroded unit is intervened, the relative importance of its downstream neighbors is reduced. Similarly, by placing buffers, the effective contribution of upstream neighboring units will also be reduced. Therefore, after implementing intervention activities for each specific unit, the importance ranking of the unit must be updated.
5.4 Hungarian large-scale watershed with stations
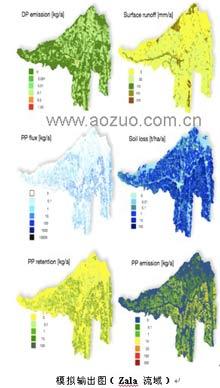
The PhosFate system simulates water balance, soil erosion, phosphorus emissions and loads for water quality assessments of different management plans in small watersheds throughout Hungary. Four pilot watersheds were selected for calibration and detailed analysis. This is to provide parameter ranges for subsequent applications in other non-station watersheds. The emissions, particulate phosphorus (PP) and soluble reactive phosphorus (SRP) loads measured at the pilot watershed outlet observation station were used as calibrations. Each parameter has been successfully calibrated at the end point, and the best parameter value (with the measured value) shows significant similarity.
The Zala watershed is one of the pilot watersheds used to calibrate the model. Not only at the exit of the basin, but also at the other three monitoring stations along the river, the output of the calibrated model is in good agreement with the measured value. The calculated average travel time in the main channel is very close to the estimate based on the propagation speed of the small flood peak.
The good performance of the model allows it to be extended to watersheds outside the calibration area. In addition to calculating benchmark values, five national management strategies have also tested nutrient load and water quality. Tests have shown that spontaneous and uniform application of land-use management strategies (formerly BMP optional measures) is a method without economic and social benefits to reduce erosion and eutrophication. Implementing optimal interventions in identified “hot spots†can increase the cost-effectiveness by a factor of two, and, in the case of a significant decrease in total erosion, the area of ​​impact is reduced by 50%.
Therefore, the application of PhosFate in a representative area with stations is helpful for high-precision watershed management assessment and design for non-station watersheds.
5.5 Large-scale, non-stational watershed in Albania 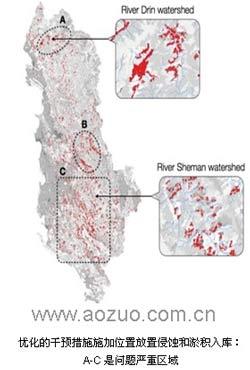
Albania (28 750 km2) is a small European country located between the Adriatic and Aeolian coasts and the Balkan Mountains. The eastern part of the coast is plain, while the rest is mountainous. The country ’s assessment of the contribution of hydrology, sediment and nutrient load to the entire Mediterranean is scarce, and its accuracy is not accurate.
PhosFate's mission is to use the country's high spatial resolution data to benchmark the erosion status at the time and test the effectiveness of the designed interventions. In addition, the uncertainty caused by missing data is also analyzed.
In order to complete the erosion and sediment transport assessment, a GIS database that meets PhosFate requirements was established. The necessary digital maps and climate data were collected from different sources. In addition, SS load data and other erosion studies were collected from the literature to calibrate the model and perform comparisons.
By comparing the evaluation results in the literature, the long-term average discharge of the river is corrected. Single parameter groups are used throughout the country. The calculated emission values ​​are in good agreement with the monitoring data. The maximum deviation from the evaluation values ​​in the literature (not very accurate) is 30%. The parameters of soil erosion and retention are corrected. Therefore, the calculated The contribution rate of the load is consistent with the relevant data in the literature.
Soil erosion is generally significant throughout the entire region of Albania, but it is particularly significant in the three small areas located in the north, center and south of the country.
Similar to the results of Grazhdani (2006), in these three small areas, the soil erosion rate is as high as 10 tï¹’ ha-1ï¹’ a-1 (tons per hectare per year), even the loss rate exceeds 100 tï¹’ ha-1ï¹’ The situation of a-1 also appears frequently.
The national average soil loss rate is 31.5 tï¹’ ha-1ï¹’ a-1, this number greatly exceeds 10 tï¹’ ha-1ï¹’ The tolerance of a-1 is in line with the average loss rate reported by Bockheim (1997).
Nearly 80% of the country ’s total area is suffering from soil erosion. However, the remaining 20% ​​of the area is the main reason for most (93%) soil erosion results.
The area with the highest soil loss level is the smallest (8% of its land area), yet it produces 79% of the total soil loss.
Despite the huge amount of soil loss (90.5 × 10⁶ t﹒ha-1﹒a-1) produced in the country, only about 60 × 106 tons / year of suspended sediment was transported to the ocean through rivers. Therefore, about one-third of the lost soil cannot reach the ocean because of the retention capacity of the transport path. A considerable amount of sediment retention is caused by sedimentation. This sedimentation may occur on the ground, and the speed of local surface runoff decreases (slope slows, land cover changes); it may also occur in the river system. When the flow speed is due to channel hydrology Change and decline (reservoir, channel for vegetation growth, slow water area, and flow through floodplain).
In those clear soil loss rates calculated values ​​are higher than 10 t﹒ ha-1﹒ In the area of ​​a-1, management plan analysis was implemented according to several intervention methods. In addition to this, buffer zones along permanent waterways were also evaluated.
In addition to the evaluation of integrated management strategies, optimal intervention procedures are also applied. The goal is to reduce the maximum load to 4.5% of the total area through intervention measures. The effectiveness of interventions varies from basin to basin, with reductions ranging from 50% (Erzeni) to 68% (Vjosa). Similarly, the spatial distribution of intervention sites in the country is not uniform. Most interventions are concentrated in 3 main areas. At the national level, these three areas are hot spots for erosion and sediment load.
references:
Bockheim JG. Proposal to study economic and environmental benefits of reducing soil erosion in Albania. Land Tenure Center, University of Wisconsin, Madison USA; 1997.
Borah DK, Bera M. Watershed-scale hydrologic and nonpoint-source pollution models. Review of mathematical bases. Trans ASAE 2003; 46 (6): 1553–66.
Campbell N, D'Arcy B, Frost A, Novotny V, Sansom A. Diffuse Pollution: An Introduction to the Problems and Solutions. London: IWA Publishing; 2004.
Fread DL. Flow routing. In: Maidment DR, editor. Handbook of Hydrology. New York: McGraw-Hill; 1993. p. 10.1–10.36.
Grazhdani S. Albania, in: Soil Erosion in Europe (eds Boardman J and Poesen J), John Wiley & Sons Ltd, Chichester, UK. 2006.
Kovacs AS, Honti M, Clement A. Design of best management practice applications for diffuse phosphorus pollution using interactive GIS. Wat Sci Tech 2008; 57: 1727-33.
Liu YB, de Smedt F. WetSpa Extension: A GIS-based Hydrologic Model for Flood Prediction and Watershed Management, User Manual. Brussels: Vrije Universiteit Brussel; 2008.
Liu ZJ, Weller DE. A Stream Network Model for Integrated Watershed Modeling. Environ Model Assess 2008; 13 (2): 291-303.
Neitsch SL, Arnold JG, Kiniry JR, Williams JR, King KW. Soil and Water Assessment Tool. TWRI Report TR-191. Temple USA: Agricultural Research Service; 2002.
Novotny V. Diffuse Pollution and Watershed Management. Hoboken USA: Wiley; 2003.
Ritter WF, Shirmohammadi A, editors Agricultural Nonpoint Source Pollution. Boca Raton USA: CRC Press; 2001.
Strahler AN. Quantitative analysis of watershed geomorphology. EOS T Am Geophys Un 1957; 8 (6): 913–20.
Vollenweider RA. Advances in defining critical loading levels for phosphorus in lake eutrophication. Mem Ist Ital Idrobiol 1976; 33: 53-83.
Vollenweider RA, Kerekes J. Eutrophication of waters. Monitoring, assessment and control. OECD Cooperative programme on monitoring of inland waters (Eutrophication control), Paris: Environment Directorate, OECD; 1982. p. 154.
White DW, Smith RA, Price CV, Alexander RB, Robinson KW. A spatial model to aggregate point-source and non-point source water-quality data form large areas. Comput Geosci 1992; 18 (8): 1055-73.
Commercial Plywood,Sapele Commercial Plywood,Okoume Hardwood Plywood,Natural Wood Pencil Cedar Plywood
Shandong Yami Import and Export Co., Ltd. , https://www.yamiwood.com